


Predicting the Final CRC Reoffending Rates
Predicting the Final CRC Reoffending Rates
On October 26th 2017, the Ministry of Justice will publish the first Transforming Reoffending proven reoffending rates. These will describe the October to December 2015 cohort’s proven reoffending rate and compare this to a 2011 baseline rate (go here for an explanation). If a Community Rehabilitation Company (CRC) does better than the baseline rate they will be paid a bonus. In this blog I am using descriptive statistics to present a prediction of what the final rates will be.
England and Wales Reoffending Rate
Over the last year the Ministry of Justice has published this cohort’s, and each subsequent cohort’s, reoffending rate every 3 months. The national reoffending rate across all CRCs is described in the figure below (these figures are adjusted for differences in likelihood of reoffending across cohorts). Each bar represents a different cohort and gaps exist where the data have not yet been published.

Source: Ministry of Justice Proven Reoffending Quarterly Statistics
Definition: Months after commencement is the minimum number of months after commencement for an offender in the October 2015 to December 2015 cohort. However in the figures published, the follow up period varies depending on when within those 3 months the offender started.
The results are similar across the cohorts. After 8 months, 33% of offenders will have reoffended, and then 39% after 11 months, 42% after 14 months and 43% after 17 months. Most offending will occur within the first 8 months and the subsequent increases are smaller each time.
Predicting the final October to December 2015 rate
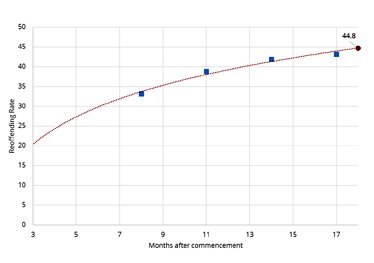
In order to predict the final reoffending rate at 18 months I need to estimate the trend. There are different options for doing this, and I will explain in a forthcoming blog how I selected the appropriate method. However, the trend I calculated for the October to December 2015 cohort is presented in the figure below.

Source: Ministry of Justice Proven Reoffending Quarterly Statistics
Definition: Months after commencement is the minimum number of months after commencement for an offender in the October 2015 to December 2015 cohort. However in the figures published, the follow up period varies depending on when within those 3 months the offender started.
The blue squares describe the published England and Wales reoffending rates, the red line is the fitted trend, and the red dot describes the predicted reoffending rate after 18 months. The predicted reoffending rate was just under 45% using this method. The selected reoffending trend is a curve to represent the reduction in the rate of increase as time progresses. Even from the limited data released, the curve shows an expected rapid increase in the first months after the start of an order or licence, but over time this increase is not sustained. This trend is consistent with other research we have conducted using more detailed data.
October to December 2015 CRC results
I extended the same analysis to individual CRCs. When the final results are published, a CRC’s reoffending rate will be compared to a 2011 baseline rate. Since individual baseline rates for each CRC’s baseline have not been published, I cannot anticipate that analysis. However, the baseline OGRS scores (a measure of how likely someone is to reoffend) have been published and so I was able to compare a CRC’s predicted reoffending rate to the baseline OGRS rate, adjusting for differences in the likelihood of reoffending between the baseline and the October to December 2015 cohorts. The spread in differences between the baseline OGRS rate and the predicted reoffending rate for each CRC are presented in the figure below. I have anonymised each CRC because I believed highlighting relative performance in the public domain with important information missing would not be ethical. If, however, you want to know how your CRC or area is performing please contact me.

Source: Ministry of Justice Proven Reoffending Quarterly Statistics
Eight of the 21 CRCS were predicted to beat the baseline OGRS score. The largest difference is 5.1%, followed by two CRCs expected to beat the baseline OGRS score by 4.4%. Twelve of the CRCs were predicted to perform worse that the baseline OGRS. For five of these the difference is less 1%, but three were expected to exceed the baseline OGRS rate by more than 3%.
Next steps
The analysis presented here is based upon a description of the data. The analysis therefore does not allow for the uncertainty in the predicted reoffending rate. A more realistic analysis would present the range of outcomes that are likely to happen. The presented analysis also assumes that the data are independent. In fact a CRC’s current reoffending rate will be dependent upon the rate 3 months ago and the current rate cannot be lower than the previous measure. A statistical model can allow for these issues and I will present that approach in a subsequent blog. This does not mean the presented results are wrong. Instead, it means greater insight and use is possible as we expand the analytical approach.


